Trading Risk Management Calculator– ( Here )
Introduction
How to use trading risk management calculator is an essential skill for traders who want to control risk, calculate position size, and trade with discipline without emotion.
The Trading Risk Management Calculator is a professional-grade tool designed to help traders manage their capital efficiently, calculate optimal position sizes, and maintain trading discipline. This calculator combines multiple essential risk management concepts into one powerful, easy-to-use interface.
Whether you’re a day trader, swing trader, options trader, crypto trader, or forex trader, this tool will help you protect your capital and maximize your long-term profitability by enforcing strict risk management rules.
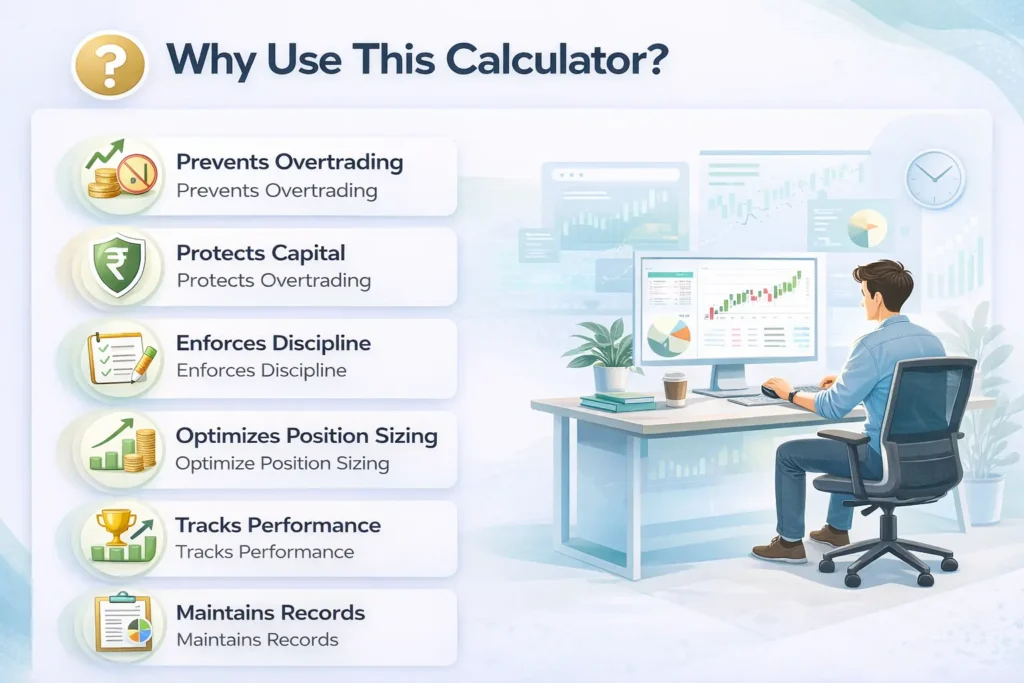
Why Use This Calculator?
Core Benefits
- Prevents Overtrading: Automatically limits your risk per trade and per day
- Protects Capital: Dynamic risk adjustment based on P&L prevents catastrophic losses
- Enforces Discipline: Lock mechanism prevents emotional changes to risk parameters mid-trading
- Optimizes Position Sizing: Calculates exact quantity based on your stop loss and risk tolerance
- Tracks Performance: Built-in analytics with equity curve and win rate charts
- Maintains Records: Export trade logs for tax reporting and performance analysis
Who Should Use This Calculator?
- Day Traders: Manage intraday risk across multiple trades
- Options Traders: Calculate precise position sizes for premium collection or directional bets
- Forex Traders: Determine lot sizes based on pip risk and account balance
- Swing Traders: Plan multi-day trades with proper risk allocation
- Beginner Traders: Learn professional risk management from day one
- Professional Traders: Streamline risk calculations and maintain consistent execution
Trading Risk Management Calculator– ( Here )
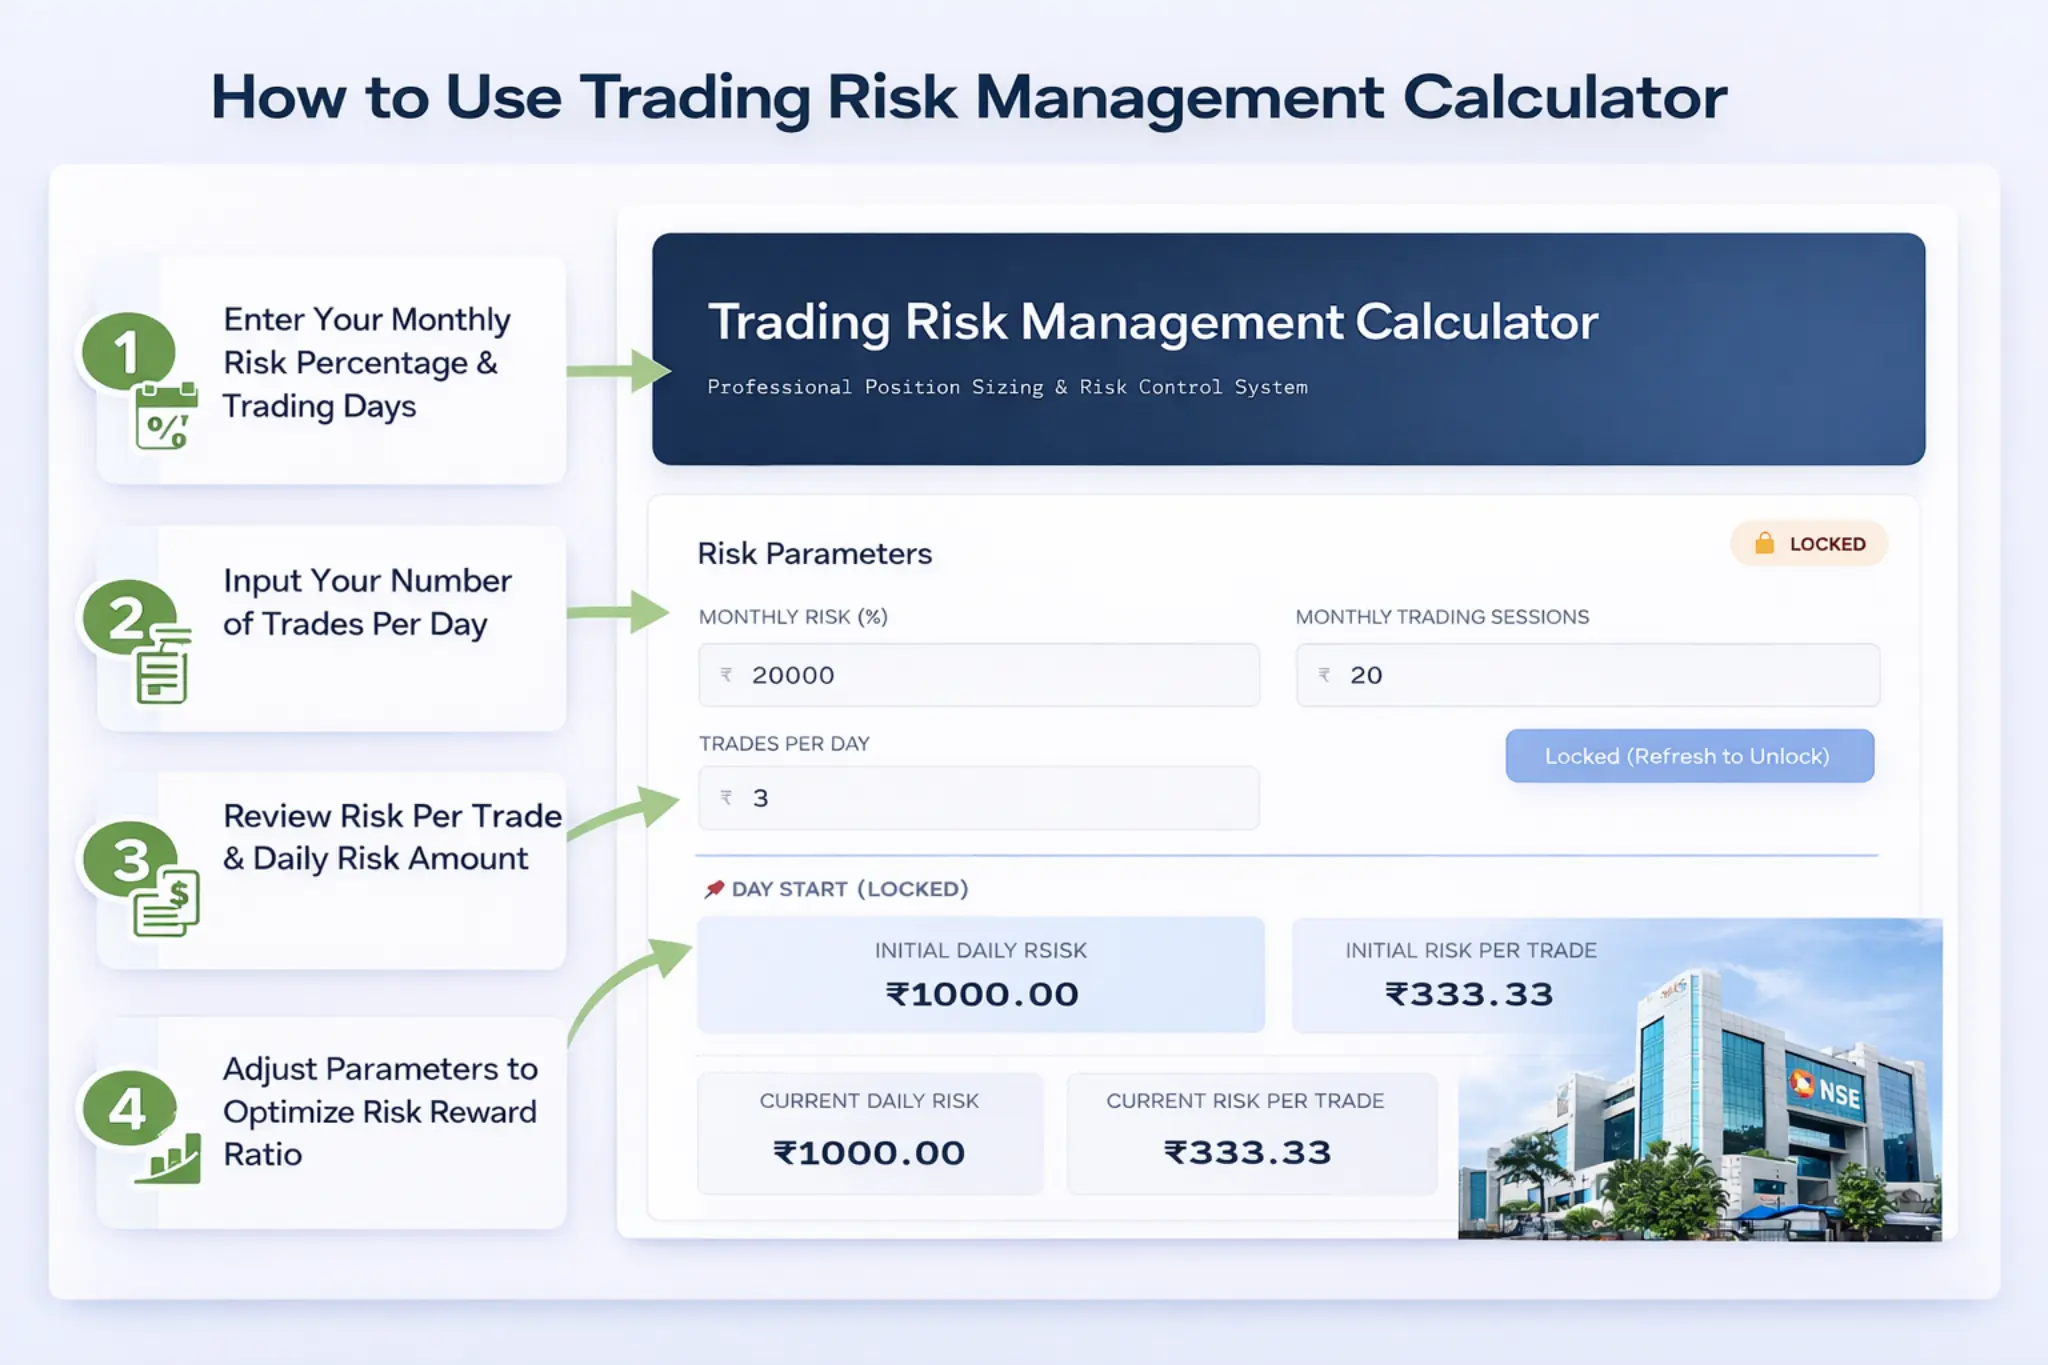
How to Use Trading Risk Management Calculator – Getting Started
Step 1: Set Your Risk Parameters
Before you start trading, you need to configure three critical parameters:
1. Monthly Risk (₹)
- What it is: The maximum amount of capital you’re willing to risk in one month.
- How to calculate: Generally 3–5% of your total trading capital.
- Important: This should be money you can afford to lose without affecting your financial stability.
2. Monthly Trading Sessions
- What it is: Number of trading days in the month.
- Typical values: 19–22 days (accounting for weekends and market holidays)
- Example: If February has 28 days with 4 weekends and 1 holiday = 19 trading sessions
3. Trades Per Day
- What it is: Maximum number of trades you plan to take per day.
- Recommended:
- 3–5 trades for day traders
- 1–2 trades for swing traders
- Why it matters: Prevents overtrading and ensures proper risk distribution throughout the day
Step 2: Lock Your Parameters
Once you’ve entered your risk parameters, click the “Lock & Start Trading” button.
What Happens After Locking?
- Parameters are frozen: You cannot change Monthly Risk, Sessions, or Trades Per Day
- Day Start section appears: Shows your initial Daily Risk and Risk Per Trade values
- Calculated values display: Shows Current Daily Risk, Current Risk Per Trade, and Current Monthly Risk
- Add Trade button activates: You can now start logging your trades
To unlock: Refresh the page.
This ensures you set parameters carefully and thoughtfully.
Understanding Calculated Values
Day Start Values (Locked)
These values are calculated when you lock your parameters and remain fixed throughout the trading day. They serve as a reference point to see how your risk has changed based on your trading performance.
- Initial Daily Risk:
If all your trades initially decided hit stop loss today, you would lose a maximum of initially calculated daily risk amount only. - Initial Risk Per Trade:
The maximum amount you should risk on any single trade. It is decided at the beginning of the day.
Current Values (Dynamic)
These values update automatically based on your trading P&L.
- Current Monthly Risk:
Your adjusted monthly risk after accounting for today’s P&L- Why it matters:
When you’re winning, you can take slightly larger positions.
When losing, your risk automatically scales down to protect capital.
- Why it matters:
- Current Risk Per Trade:
Adjusts automatically as Current Monthly Risk changes. - Current Daily Risk:
Shows your maximum exposure for the remaining trades today based on current performance.

Trade Journal Fields Explained
New Trade Entry
Click the “Add Trade” button to create a new trade entry. A new row will appear in the trade journal table.
- Trade Number
Auto-generated sequential number for each trade. Helps you track the order of execution. - Stop Loss (Points)
The difference between your entry price and stop loss in points. - Risk:Reward Ratio
The ratio of potential profit to potential loss. It means how much risk you are willing to take to get expected desired target profit.
Generally, aim for at least 1:2 ratio. - Quantity (Auto-calculated)
Automatically determined by the calculator.- Tighter SL = higher quantity
- Wider SL = lower quantity
- P&L (₹)
Your actual profit or loss from the trade.
You must enter real P&L manually to account for actual cash flows including charges.Critical: The moment you enter P&L, your Current Monthly Risk updates automatically. - Strategy (Optional)
Example: Flag Pattern, Breakout, Support Bounce, Moving Average Crossover, etc. - Timeframe (Optional)
Example: 5min, 15min, 1hr, Daily - Remark (Optional)
Notes about the trade — what went right, what went wrong, market conditions, emotions, etc. - Delete
Removes a trade entry. If the trade had P&L, it will be reversed from your Current Monthly Risk.
Performance Analytics & Statistics
Statistics Dashboard
The calculator displays four key performance metrics that update in real time:
- Total Trades
Number of trades logged. Helps monitor overtrading or undertrading. - Win Rate (%)
Percentage of profitable trades.Interpretation:- 60%+ → Excellent (with proper risk-reward)
- 45–60% → Good (need 1:2 or better R:R)
- 30–45% → Acceptable (need 1:3 or better R:R)
- Below 30% → Review strategy immediately
- Total P&L
Sum of all profits and losses. - Average Win
Compare with Average Loss (calculated manually).
If Average Win > Average Loss, strategy has positive expectancy even with 50% win rate.
Pro Tip: Aim for Average Win to be at least 2× Average Loss.
Performance Charts
Equity Curve
- What it shows: Cumulative P&L progression trade by trade
- How to read it:
- Upward trend → Consistent profits
- Downward trend → Losses accumulating
- Flat line → Break-even
- Choppy → Inconsistent results
Ideal curve: Smooth upward trajectory with minimal drawdown.
Win Rate Progression
- Shows win rate evolution over trades
- Interpretation:
- Stabilizing at 50–70% → Excellent
- Declining → Warning sign
- Highly volatile → Not enough data
- Rising → Strategy improving
Export & Record Keeping
Download Trade Log (CSV)
Click “Download Trade Log (CSV)” to export all trades.
Export Includes:
- Trade details: Number, SL, R:R, Quantity, P&L, Strategy, Timeframe, Remarks
- Summary statistics: Total Trades, Win Rate, Total P&L
- Risk parameters: Initial Monthly Risk, Current Monthly Risk
Why Export?
- Performance analysis
- Pattern recognition
- Accountability and journaling
Trading Risk Management Calculator – ( Here )

Best Practices & Pro Tips
Daily Routine
- Morning setup before market opens
- Lock parameters
- Note day start values
- Log every trade
- Update P&L immediately
- Monitor statistics
- Export CSV at end of day
Risk Management Rules
- Stop trading after 3 consecutive losses
- Never override lock mid-day
- Respect calculated quantity
- Honor stop loss
- Stop trading for the month if monthly risk drops 50–60%
Strategy Optimization
- Use Strategy field consistently
- Review weekly
- Eliminate losing setups
- Focus on high-performing strategies
Common Mistakes to Avoid
- Setting monthly risk too high
- Not locking parameters
- Missing trade logs
- Ignoring quantity
- Overtrading
- Not exporting data
- Revenge trading
Final Thoughts
The Trading Risk Management Calculator is not just a tool — it is a framework for professional trading discipline.
It enforces the three pillars of successful trading:
- Risk Control
- Position Sizing
- Performance Tracking
Remember: Trading is a marathon, not a sprint.
The goal is consistency, survival, and long-term profitability.
Trade smart. Trade safe. Trade successfully.